

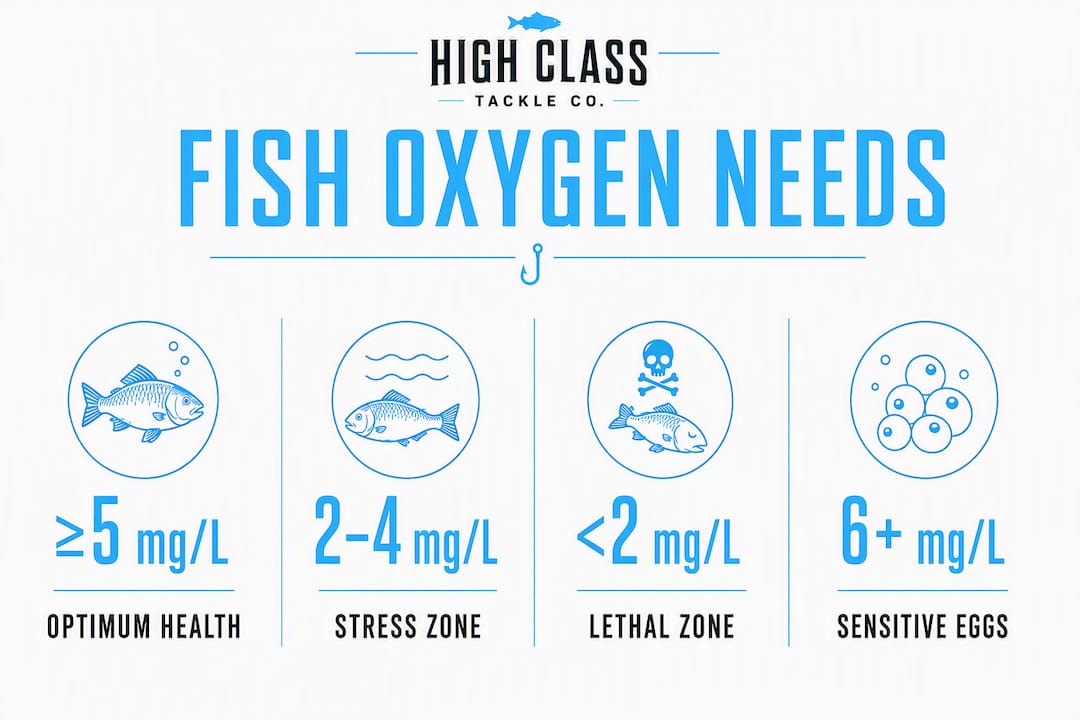
Dissolved oxygen (DO) is the single most powerful abiotic filter controlling where fish live, feed, and survive. When DO drops below 5 mg/L, fish begin abandoning preferred habitat. Below 2 mg/L, mortality follows fast. Research from the University of Florida IFAS Extension puts the distress zone at 2–4 mg/L and the lethal threshold below 2 mg/L — numbers every serious angler and pond manager needs locked in before they ever drop a line or a probe.
Those thresholds shift with temperature. Warmer water holds less oxygen while simultaneously driving up a fish’s metabolic demand. A reading of 5 mg/L at 60°F means something very different than 5 mg/L at 80°F, because the fish’s oxygen need is higher in warm water even as the supply shrinks.
Three things to act on right now:
- Sample at depth and near inflows, not just at the surface. DO can vary dramatically within a few feet of depth, and a single surface reading will mislead you.
- Expect the lowest DO of the day just before dawn. Respiration runs all night; photosynthesis stops. That pre-dawn window is when hypoxia events are most likely to peak.
- If DO falls below 4 mg/L, begin aeration or move fish immediately, as most species begin to show distress at this threshold. Waiting for visible stress signs means you are already behind the curve.
Pro Tip: Fish the first two hours after sunrise in still, shallow systems. DO climbs fast once photosynthesis kicks in, and fish that were pushed to margins or surface layers by overnight hypoxia will move back into feeding zones. That transition window is often the most productive of the day.
Table of Contents
- How does dissolved oxygen get into water, and how do you measure it?
- What DO levels do fish actually need, and how does tolerance vary by species?
- What drives oxygen levels up and down in rivers, lakes, and ponds?
- How do fish detect and respond to falling oxygen levels?
- What happens to fish populations when low DO persists?
- How should you monitor DO and respond when levels drop?
- Key Takeaways
- Why DO-informed fishing changes everything
- Useful sources
How does dissolved oxygen get into water, and how do you measure it?
Dissolved oxygen is simply molecular oxygen (O₂) that has dissolved into water and is available for fish to extract through their gills. Two units describe it: milligrams per liter (mg/L), which measures the actual mass of oxygen in a volume of water, and percent saturation (%), which compares that amount to the maximum the water could hold at a given temperature and altitude. At sea level and 77°F, fully saturated water holds roughly 8 mg/L, which equals 100% saturation. Both units appear in field data, so knowing how to read each one matters.
Oxygen enters the water column through three main pathways. Direct atmospheric diffusion across the water surface is slow but constant, driven by wind and wave action that increase surface area and turbulence. Photosynthesis by algae and aquatic plants is the dominant daytime source in most ponds and shallow lakes, producing oxygen directly in the water column during daylight hours. Upwelling, inflows, and mechanical mixing (waterfalls, rapids, aeration equipment) deliver oxygenated water from outside the system or from surface layers into deeper zones.
Oxygen leaves the water through respiration by fish, invertebrates, bacteria, and plants at night, and through decomposition of organic matter. The result is a predictable diurnal cycle: DO peaks in the afternoon after hours of photosynthesis, then drops steadily through the night as respiration continues unchecked, hitting its lowest point just before dawn.
| Method | Accuracy | Best Use Case |
|---|---|---|
| Winkler titration | Very high | Lab verification, calibration reference |
| Electrochemical probe | Moderate | Field spot-checks, quick reads |
| Optical (luminescent) probe | High | Field use, minimal maintenance, aquaculture |
| Data logger / sonde | High, continuous | Long-term monitoring, diurnal cycle capture |
For field sampling, optical probes are the current standard. They require less calibration maintenance than electrochemical sensors and perform reliably across temperature ranges. Data loggers deployed at multiple depths give you the full picture of stratification and diurnal swings. Always sample near the bottom, near cover, and at the thermocline, not just at the surface, especially during warm months when stratification is strongest.
What DO levels do fish actually need, and how does tolerance vary by species?
The IFAS threshold framework gives a clean starting point: optimum fish health at ≥5 mg/L, distress at 2–4 mg/L, and mortality commonly beginning below 2 mg/L. Those numbers hold broadly across freshwater species, but tolerance varies significantly by species, life stage, and environmental context.
| DO Range (mg/L) | Biological Outcome | Example Taxa |
|---|---|---|
| ≥5 | Optimum fish health, normal feeding and growth | Most freshwater species, including salmonids |
| 2–4 | Distress zone, reduced activity, stress | Many species including catfish, carp, tilapia |
| <2 | Mortality common in most species | Nearly all fish |
Salmonids sit at the demanding end of the spectrum. Brook trout, for example, actively avoid water below approximately 4 mg/L and consistently select areas at or above 5 mg/L when given a choice. That behavioral threshold is not just a preference — it reflects the physiological reality that aerobic scope collapses as ambient oxygen falls toward the critical oxygen tension (O₂crit).
Body size and cell size also shape tolerance. Research published in PMC shows that larger fish with larger cells tend to be less tolerant of hypoxia at elevated temperatures, because oxygen diffusion distance across larger cells is greater. Smaller fish can sometimes sustain aerobic function at lower DO, though this advantage disappears at high temperatures. The practical implication: big fish in warm, low-oxygen water are the first to show functional impairment.
Key species-level patterns worth knowing:
- Salmonids (salmon, steelhead, trout): Prefer ≥5 mg/L; show avoidance behavior below 4 mg/L; highly vulnerable during summer low-flow periods in Pacific Northwest rivers.
- Juvenile estuarine species (flounder, drum, spot): Growth suppression documented at sustained DO below 4 mg/L; severe avoidance responses at ≤2 mg/L regardless of food or substrate availability.
- Warmwater species (bass, catfish, carp): More tolerant of short-term dips into the 3–4 mg/L range, but sustained exposure still reduces growth and reproductive success.
Life stage matters too. Eggs and larvae are generally the most sensitive, with many species requiring DO above 6 mg/L for successful incubation. Adults can tolerate brief excursions lower, but chronic exposure to even moderate hypoxia compounds into measurable production losses over a season.
What drives oxygen levels up and down in rivers, lakes, and ponds?
Temperature is the master variable. Cold water holds more oxygen than warm water — a physical property called Henry’s Law — and fish in warm water simultaneously need more of it to sustain metabolism. This “metabolic squeeze” is why summer is the most dangerous season for hypoxia events. A river running at 75°F holds roughly 30% less oxygen at saturation than the same river at 50°F, while the salmon holding in that water may need twice as much to maintain aerobic activity.
Physical stratification amplifies the problem. In lakes and reservoirs during summer, warm surface water sits atop cold, denser bottom water. The thermocline acts as a barrier to mixing, trapping oxygen-depleted water in the hypolimnion (the deep layer) where decomposition consumes whatever oxygen remains. Fish get squeezed between a warm, oxygen-adequate surface and a cold but hypoxic bottom, often concentrating at the thermocline edge where conditions are marginally tolerable.
Wind and inflows disrupt stratification and deliver oxygen. Windblown shorelines, river mouths, and areas near waterfalls or rapids consistently show higher DO than calm, sheltered bays. Salinity reduces oxygen solubility too, which is why coastal estuaries and marine systems can experience hypoxia at DO concentrations that would seem adequate in freshwater.
On the biological side, algal blooms are a double-edged threat. Dense blooms produce oxygen during the day but consume massive amounts at night through respiration. When a bloom crashes and the algae decompose, bacterial respiration can strip the water column of oxygen within hours, creating acute fish kills. High organic loading from agricultural runoff, fish waste in aquaculture ponds, or leaf litter in small ponds all accelerate this process by fueling bacterial oxygen demand.
Pro Tip: Watch for the combination of calm, hot nights following dense algae blooms. That is the highest-risk window for overnight oxygen crashes. If you see surface scum or a strong algae smell at dusk, check DO before midnight, not at dawn.
How do fish detect and respond to falling oxygen levels?
Fish do not passively wait for oxygen to become lethal. They respond in a cascade of behaviors that escalate as DO falls, and understanding that sequence tells you exactly where they will be.
The physiological framework starts with the limiting oxygen level (LOL) and O₂crit concepts. As ambient DO declines, fish first maintain aerobic scope by increasing ventilation rate (faster gill beats). Below O₂crit, aerobic metabolism can no longer be fully sustained, and the fish must either find better-oxygenated water or shift toward anaerobic pathways. Anaerobic metabolism is inefficient and produces lactate, which impairs muscle function and immune response. The fish is now in a race.
The behavioral sequence, roughly in order of escalation:
- Reduced feeding and activity. The first sign. Fish stop chasing prey aggressively and hold in slower water to conserve oxygen.
- Increased ventilation. Gill movements speed up visibly. Fish may orient toward current or surface.
- Aquatic surface respiration (ASR). Fish gulp at the surface film, where DO is highest due to atmospheric contact. This is a distress signal, not normal behavior.
- Vertical migration. Fish move up toward the surface or toward oxygenated inflow layers, abandoning preferred depth zones.
- Lateral movement to refugia. Fish push toward inflows, aerated margins, windblown shorelines, or any zone where DO is above their critical threshold.
The estuarine fish research is striking on this point. Choice experiments with juvenile estuarine fishes showed that at DO concentrations at or below 2 mg/L, fish abandoned preferred substrate and food-rich areas entirely, selecting higher-DO zones even when those zones offered no other habitat value. Oxygen became the only variable that mattered.
Brook trout avoidance experiments confirm the same pattern at higher thresholds. Fish consistently moved away from zones below 4 mg/L and concentrated in areas above 5 mg/L, even when the low-oxygen zone contained food. The behavioral threshold precedes the physiological lethal threshold by a meaningful margin, which is why fish often disappear from a spot before any visible die-off occurs.
Pro Tip: During summer hypoxia events, target thermocline edges, river mouths, and windblown points first. Fish pushed out of their preferred depth or cover will stack at the nearest oxygen refuge. Slow presentations work better here — lethargic fish are not chasing fast-moving lures. Check out salmon fishing low water tactics for specific PNW strategies when warm, low-oxygen conditions push fish into tight holding zones.
What happens to fish populations when low DO persists?
Short-term hypoxia moves fish around. Chronic or recurring hypoxia reshapes entire fisheries.
Growth rates take the first hit. Sustained DO below optimal levels reduces feeding activity, impairs digestion efficiency, and forces fish to divert energy toward stress responses rather than growth. Studies on marine hypoxia have documented growth reductions of up to 89% in certain juvenile fish species under hypoxic conditions. That is not a marginal effect — it is the difference between a marketable fish and one that never reaches harvestable size.
Recruitment suffers next. Eggs and larvae in hypoxic zones show elevated mortality and developmental abnormalities. Species that spawn in areas prone to seasonal hypoxia face compounding losses across year classes, which can take a decade to show up clearly in catch data but are devastating when they do.
At the ecosystem level, hypoxic “dead zones” eliminate benthic invertebrate communities that form the base of many food webs. When bottom-dwelling organisms disappear, the fish that depend on them either relocate or decline. The Gulf of Mexico hypoxic zone, fed by nutrient runoff from the Mississippi River basin, is the most documented example in the United States, but similar dynamics play out in Chesapeake Bay, Pacific Northwest estuaries, and countless inland lakes.
The economic consequences are real. The same research documenting growth suppression also recorded an approximately 12.9% annual catch loss during a documented hypoxia period, with direct revenue impacts reaching approximately USD 1.25 million across the study period. For commercial and charter fisheries operating in affected regions, those numbers translate directly to lost seasons and closed businesses.
Hyperoxia, the opposite condition, carries its own risks. Supersaturated water (above 110–115% saturation) can cause gas-bubble disease, where nitrogen and oxygen form bubbles in fish tissue, blood vessels, and eyes. This occurs most often below dams where water plunges into deep pools, or in aquaculture systems with aggressive aeration. The condition is acutely lethal and often misidentified as a disease outbreak rather than a physical injury.
How should you monitor DO and respond when levels drop?
Monitoring is where science becomes action. The goal is to catch a developing problem before fish are stressed, not after they are at the surface.
For aquaculture ponds and managed water bodies, follow this sequence:
- Sample late afternoon (4–6 PM) to establish the daily peak. This reading, combined with water temperature and algae density, lets you project the overnight DO decline.
- Sample again at 10 PM. If DO has already dropped more than 2 mg/L from the afternoon peak, start aeration immediately. Do not wait for the pre-dawn low.
- Sample at 2–4 AM during high-risk periods (hot weather, dense algae, high fish density). Commercial producers use 2-hour interval sampling during these windows because the rate of decline is as important as the absolute value.
- Log readings at multiple depths. A surface reading of 6 mg/L can coexist with 1.5 mg/L at the bottom in a stratified pond. Fish holding near the bottom are already in distress.
- Set species-specific alarm thresholds. For salmonids, trigger aeration at 5 mg/L. For warmwater species, 3–4 mg/L is the practical trigger, though 5 mg/L remains the target.
Aeration options range from paddlewheel aerators (high-volume, surface-oriented, best for large ponds) to diffused air systems (bottom-up, effective for destratification) to emergency liquid oxygen injection for acute crises. The right choice depends on pond size, fish density, and how quickly DO is falling.
For anglers on natural water bodies, the monitoring toolkit is simpler but the logic is the same. A handheld optical DO meter costs less than a good rod and pays for itself the first time it explains why a spot that held fish last week is dead today.
Pro Tip: If you do not have a meter, watch for behavioral clues: fish rolling at the surface, reduced strike rates in areas that normally produce, and birds working the margins where stressed fish have pushed shallow. Those are real-time DO alarms. If you see them, move to the nearest inflow, aerated zone, or windblown point and start there.
For longer-term management, reducing organic loading is the most durable fix. Control nutrient inputs, manage algae density before blooms peak, and maintain adequate water exchange rates. In rivers, protecting riparian vegetation and maintaining flows during critical summer periods directly supports DO by keeping water temperatures down and turbulence up. Adapting your terminal tackle selection to match the slower, more deliberate presentations that work on lethargic, oxygen-stressed fish is a practical angler-side response to conditions you cannot control.
Key Takeaways
Dissolved oxygen is the primary control on fish location, and knowing the thresholds, timing, and monitoring triggers gives anglers and managers a decisive edge over those fishing blind.
| Point | Details |
|---|---|
| Preferred DO threshold | Optimum fish health at ≥5 mg/L; distress occurs at 2–4 mg/L; and mortality commonly begins below 2 mg/L. |
| Mortality risk zone | DO below 2 mg/L triggers mortality in nearly all fish species; act before reaching this level. |
| Temperature interaction | Warm water holds less oxygen and raises fish metabolic demand simultaneously, compressing the safe DO window. |
| Worst time of day | Pre-dawn is the daily DO minimum; sample then to catch the highest-risk window in still systems. |
| Top monitoring action | Sample at multiple depths and near inflows, not just the surface, to find where fish are actually holding. |
Why DO-informed fishing changes everything
Most anglers chase structure. The best ones chase oxygen. After spending time on Pacific Northwest rivers and coastal systems, the pattern becomes impossible to ignore: the spot that held fish yesterday can be empty today, not because the fish moved to better cover, but because the DO dropped two milligrams overnight and the fish relocated to the nearest inflow seam or windblown point.
What the science confirms is what experienced anglers already feel intuitively. Fish are not randomly distributed. They are solving an oxygen equation in real time, and once you understand the thresholds, the diurnal cycle, and the microhabitat variability, you stop guessing and start reading water the way fish actually experience it.
The piece most guides miss is the temperature interaction. A DO reading that looks fine at 8 AM can be functionally inadequate by 2 PM if water temperature has climbed four degrees. That is the metabolic squeeze in action, and it explains why summer afternoon fishing in warm, still systems is so often frustrating. The fish are not gone. They are compressed into a shrinking band of tolerable conditions, usually near the thermocline edge, at inflows, or tight to aerated structure.
For aquaculture managers, the lesson is equally direct. Reactive aeration, waiting until fish are visibly stressed, costs more in lost growth and mortality than proactive monitoring ever will. The projected overnight DO decline from a late-afternoon reading is a small-data tool that works, and it requires nothing more than a reliable meter and a willingness to check at midnight.
At Highclasstackleco, we build gear for anglers who want to fish smarter, not just harder. Understanding what drives fish location, down to the dissolved oxygen in the water column, is exactly that kind of edge.
Useful sources
Authoritative references used throughout this guide, with notes on what each contributes:
- FA27/FA002: Dissolved Oxygen for Fish Production, University of Florida IFAS Extension — Primary source for DO thresholds (optimum, distress, mortality), diurnal cycle mechanics, and aquaculture monitoring protocols including nighttime sampling routines.
- U.S. EPA: Dissolved Oxygen — Regulatory and ecological context for DO standards in U.S. water bodies; useful for understanding water quality criteria and impairment thresholds.
- NOAA Behavioral/Avoidance Study (Brook Trout) — Experimental evidence for brook trout avoidance behavior below 4 mg/L and preference for ≥5 mg/L; foundational for behavioral response section.
- Body Mass and Cell Size Shape the Tolerance of Fishes to Low Oxygen, PMC/NCBI — Peer-reviewed research on how body size and cell size interact with temperature to determine hypoxia tolerance (Pcrit metrics).
- Hierarchical and Interactive Habitat Selection: The Effect of Hypoxia on Juvenile Estuarine Fishes — Choice experiment data showing DO ≤2 mg/L overrides all other habitat preferences in juvenile estuarine fish; key for behavioral case study.
- Responses by Fishes to Environmental Hypoxia: Integration Through Fry’s Concept of Aerobic Metabolic Scope, Journal of Fish Biology — Theoretical framework for O₂crit and LOL concepts connecting ambient DO to aerobic scope and behavioral thresholds.
- Growth and Fishery Impacts from Hypoxia, Gulf and Caribbean Fisheries Institute — Documents substantial growth reduction and significant annual catch loss with associated revenue impacts in hypoxic marine systems.
- Localized DO Variation and Angler Implications, USF Water Atlas — Practitioner-focused notes on microhabitat DO variability, thermocline effects, and sampling strategy for anglers.
- The Importance of Oxygen for Explaining Rapid Shifts in a Marine Fish, NSF Public Access Repository — Research linking DO availability to large-scale biogeographic shifts in marine species; relevant to climate-driven habitat compression.
- Highclasstackleco: Salmon Fishing Low Water Tactics — PNW-specific tactics for fishing during warm, low-oxygen conditions when salmon concentrate in tight holding zones.
0 comments